DAG
A DAG is a Directed Acyclic Graph, a type of graph whose nodes are directionally related to each other and don’t form a directional closed loop. In the practice of analytics engineering, DAGs are often used to visually represent the relationships between your data models.
While the concept of a DAG originated in mathematics and gained popularity in computational work, DAGs have found a home in the modern data world. They offer a great way to visualize data pipelines and lineage, and they offer an easy way to understand dependencies between data models.
DAG use cases and best practices
DAGs are an effective tool to help you understand relationships between your data models and areas of improvement for your overall data transformations.
Unpacking relationships and data lineage
Can you look at one of your data models today and quickly identify all the upstream and downstream models? If you can’t, that’s probably a good sign to start building or looking at your existing DAG.
How do you know if a model is upstream or downstream from the model you’re currently looking at? Upstream models are models that must be performed prior to the current model. In simple terms, the current model depends on upstream models in order to exist. Downstream relationships are the outputs from your current model. In a visual DAG, such as the dbt Lineage Graph, upstream models are to the left of your selected model and downstream models are to the right of your selected model. Ever confused? Use the arrows that create the directedness of a DAG to understand the direction of movement.
One of the great things about DAGs is that they are visual. You can clearly identify the nodes that connect to each other and follow the lines of directions. When looking at a DAG, you should be able to identify where your data sources are going and where that data is potentially being referenced.
Take this mini-DAG for an example:
What can you learn from this DAG? Immediately, you may notice a handful of things:
stg_usersandstg_user_groupsmodels are the parent models forint_users- A join is happening between
stg_usersandstg_user_groupsto form theint_usersmodel stg_orgsandint_usersare the parent models fordim_usersdim_usersis at the end of the DAG and is therefore downstream from a total of four different models
Within 10 seconds of looking at this DAG, you can quickly unpack some of the most important elements about a project: dependencies and data lineage. Obviously, this is a simplified version of DAGs you may see in real life, but the practice of identifying relationships and data flows remains very much the same, regardless of the size of the DAG.
What happens if stg_user_groups just up and disappears one day? How would you know which models are potentially impacted by this change? Look at your DAG and understand model dependencies to mitigate downstream impacts.
Auditing projects
A potentially bold statement, but there is no such thing as a perfect DAG. DAGs are special in-part because they are unique to your business, data, and data models. There’s usually always room for improvement, whether that means making a CTE into its own view or performing a join earlier upstream, and your DAG can be an effective way to diagnose inefficient data models and relationships.
You can additionally use your DAG to help identify bottlenecks, long-running data models that severely impact the performance of your data pipeline. Bottlenecks can happen for multiple reasons:
- Expensive joins
- Extensive filtering or use of window functions
- Complex logic stored in views
- Good old large volumes of data
...to name just a few. Understanding the factors impacting model performance can help you decide on refactoring approaches, changing model materializations, replacing multiple joins with surrogate keys, or other methods.
Modular data modeling best practices
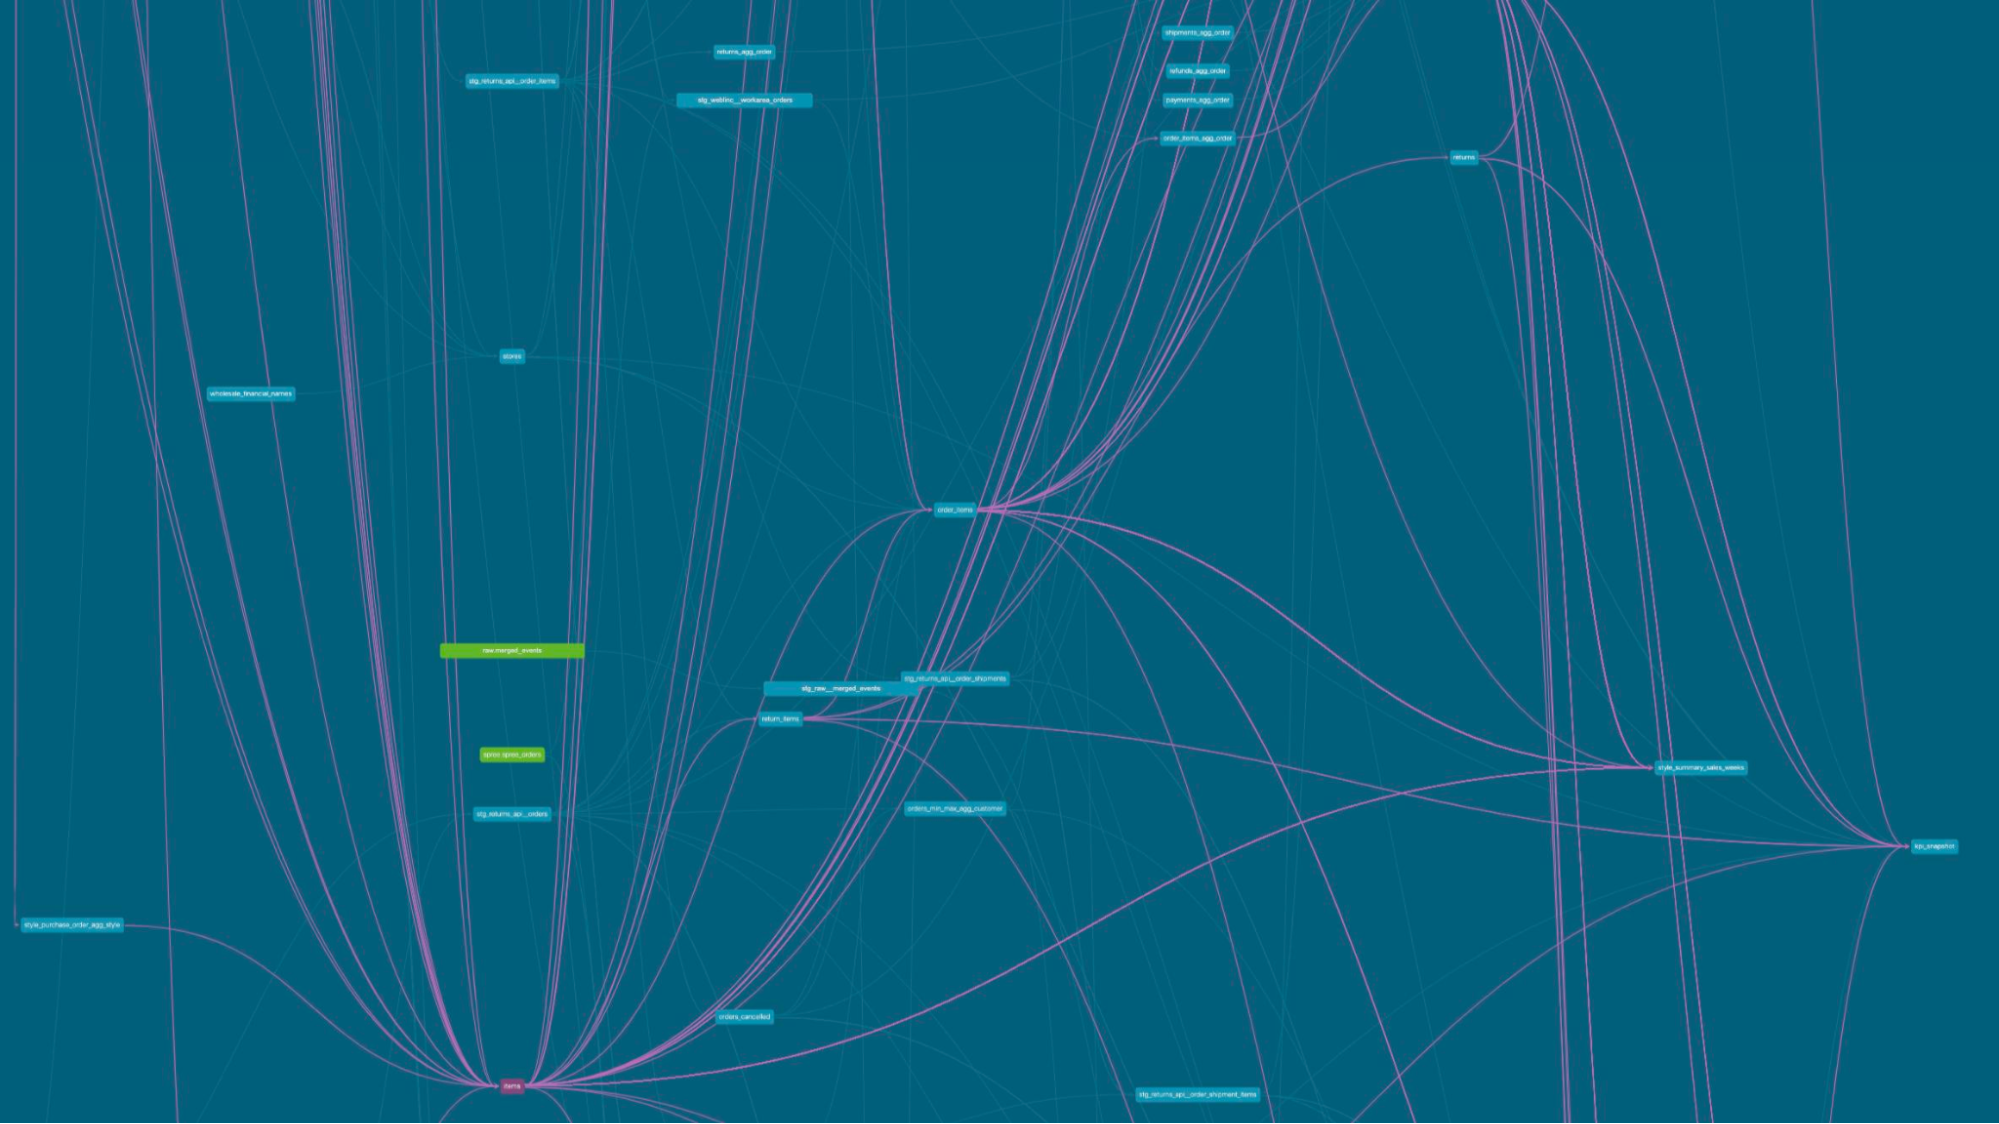
See the DAG above? It follows a more traditional approach to data modeling where new data models are often built from raw sources instead of relying on intermediary and reusable data models. This type of project does not scale with team or data growth. As a result, analytics engineers tend to aim to have their DAGs not look like this.
Instead, there are some key elements that can help you create a more streamlined DAG and modular data models:
- Leveraging staging, intermediate, and mart layers to create layers of distinction between sources and transformed data
- Abstracting code that’s used across multiple models to its own model
- Joining on surrogate keys versus on multiple values
These are only a few examples of some best practices to help you organize your data models, business logic, and DAG.
Instead of manually auditing your DAG for best practices, the dbt project evaluator package can help audit your project and find areas of improvement.
dbt and DAGs
The marketing team at dbt Labs would be upset with us if we told you we think dbt actually stood for “dag build tool,” but one of the key elements of dbt is its ability to generate documentation and infer relationships between models. And one of the hallmark features of dbt Docs is the Lineage Graph (DAG) of your dbt project.
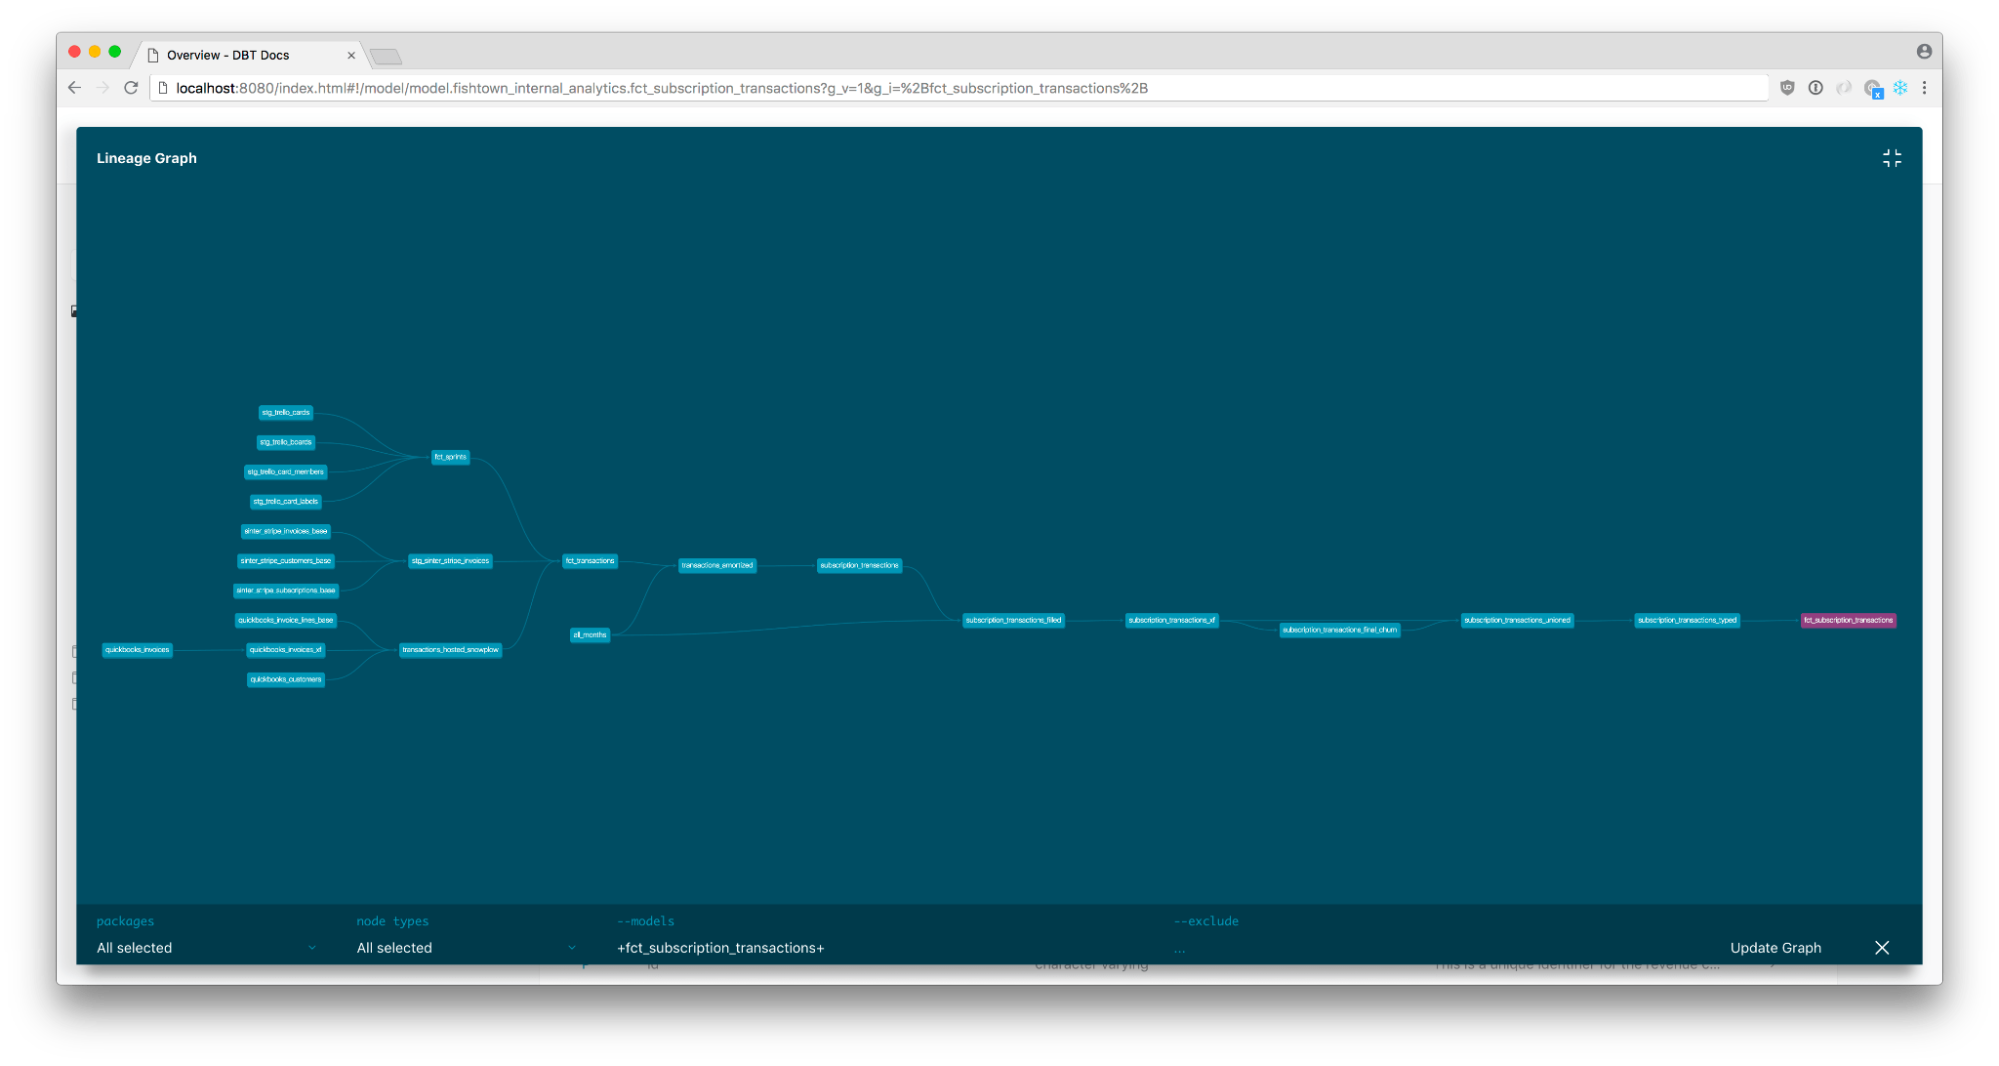
Whether you’re using dbt Core or Cloud, dbt docs and the Lineage Graph are available to all dbt developers. The Lineage Graph in dbt Docs can show a model or source’s entire lineage, all within a visual frame. Clicking within a model, you can view the Lineage Graph and adjust selectors to only show certain models within the DAG. Analyzing the DAG here is a great way to diagnose potential inefficiencies or lack of modularity in your dbt project.
The DAG is also available in the dbt Cloud IDE, so you and your team can refer to your lineage while you build your models.
One of the newer features of dbt is exposures, which allow you to define downstream use of your data models outside of your dbt project within your dbt project. What does this mean? This means you can add key dashboards, machine learning or data science pipelines, reverse ETL syncs, or other downstream use cases to your dbt project’s DAG.
This level of interconnectivity and transparency can help boost data governance (who has access to and who owns this data) and transparency (what are the data sources and models affecting your key reports).
Conclusion
A Directed acyclic graph (DAG) is a visual representation of your data models and their connection to each other. The key components of a DAG are that nodes (sources/models/exposures) are directionally linked and don’t form acyclic loops. Overall, DAGs are an effective tool for understanding data lineage, dependencies, and areas of improvement in your data models.
Get started with dbt today to start building your own DAG!
Further reading
Ready to restructure (or create your first) DAG? Check out some of the resources below to better understand data modularity, data lineage, and how dbt helps bring it all together:


